The Statistics view provides an overview of form activities and active sessions within the system.
Contents
History
The History section provides a graphical analysis of form activities over a defined time period. You can choose between evaluating individual forms or a combined analysis of all forms.
|
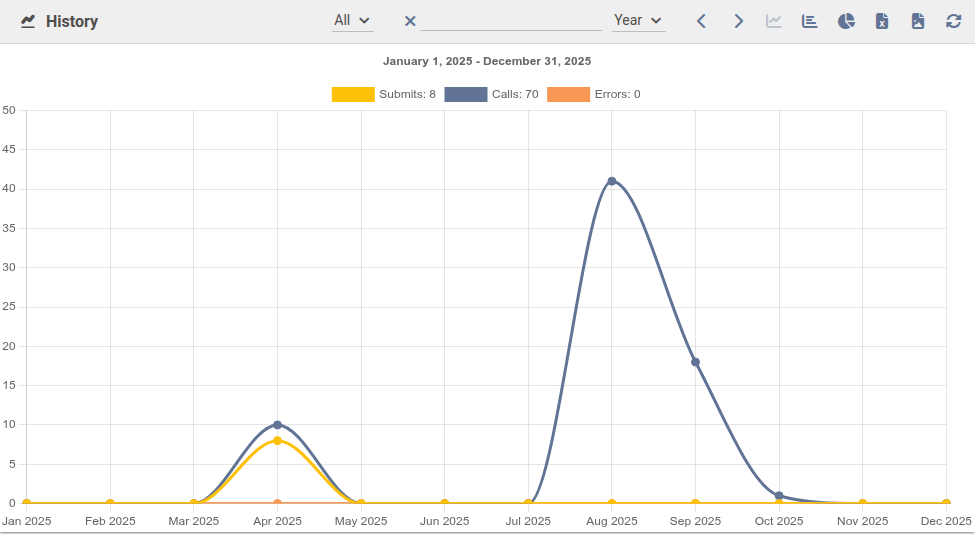
Time Period
The displayed time period can be selected using a dropdown menu. The following presets are available: day, week, month, and year. The arrow buttons allow you to navigate forward or backward within the selected period. Alternatively, a specific date can be selected directly via the calendar popup.
Chart Types
The data can be displayed using different chart types:
- Line chart – Default view showing trends over time.
- Bar chart – Displays values as bars.
- Pie chart – Shows the distribution of values.
The chart type can be changed using the buttons in the upper-right corner of the window. The visualization can be exported as an image file or as an Excel file.
Metrics
- Calls
- Number of times the form has been opened.
- Submits
- Number of times the form has been successfully submitted.
- Errors
- Number of times an error occurred.
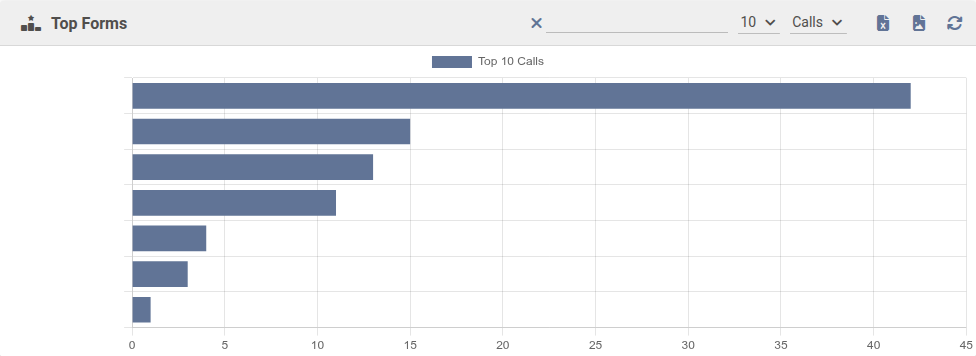
Top Forms
The Top Forms window displays a ranking of forms based on a selectable metric. A dropdown menu allows you to choose between views, submissions, and errors. The number of displayed forms can also be adjusted via a dropdown. The evaluation period can be selected directly using a calendar popup. The data is displayed as a horizontal bar chart and can be exported as an image or Excel file.
|
Active Sessions
The Active Sessions section provides an overview of the current activities in the system. It shows how many form sessions are currently open and how many users are logged in to the server. The visualization can also be exported as an image file.
|
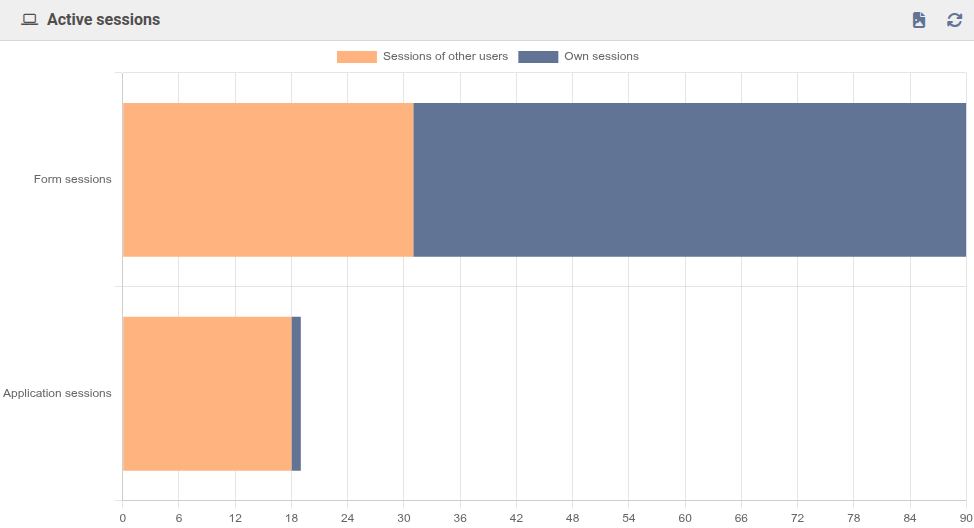
Form Sessions
Displays the number of currently active form sessions, separated into your own sessions and sessions of other users.
Application Sessions
Displays the number of active sessions currently logged in to the server, also separated into your own sessions and sessions of other users.
Groups
If users belonging to specific groups are logged in to this server, the number of logged-in group members is displayed here.
Was this article helpful?
That’s Great!
Thank you for your feedback
Sorry! We couldn't be helpful
Thank you for your feedback
Feedback sent
We appreciate your effort and will try to fix the article
